In this page, I like to record how this project has evolved. This is for my Insight Data Science project. The Insight project is designed to be finished in 4 weeks (more like 3 weeks...), from the project idea, to the final deliverable such as this website. I would say the schedule is very tight: having a good project idea is already not an easy task, not to mention many technical holes that one often need to fill during the process (such as general machine learning techniques, web-scraping, or in my case, front-end development). There are many late nights, and I have been constantly sleep deprived. But strangely, I still have the rush in the morning to wake up and get to work, just like in graduate school. I do very much enjoy the process.
Why I am interested.
I came to Insight with some vague project ideas in mind, among them is some deep dive with the Citibike data. I have explored the data previously. After the project idea "brain-storming" sections in the first week, in which many ideas came and went (where I came to embrace the term "fail fast and fail early"), I finally settled down with this Citibike project. Citibike is not a stranger to me: when it was launched in 2013, I was among the first to sign up for the membership, and used it quite often since.However, it didn't have any station installed close to where I lived (Columbia University), the north-most station only touches the south side of the Central Park - I really wished they could have expanded to more neighborhoods. When I return to the city this year, I found that there are stations as far north as 110th street. Considering that a monthly-pass MetroCard will cost me about the same as the annual Citibike membership, and Insight's office is surrounded by many Citibike stations, I immediately signed up and started using Citibike for commuting.
One problem though, is that it is very tricky to find a bike. In the morning, I need to walk more than 10 blocks to the 110th station well before 8 am, before all the bikes run out. There are few times that I need to walk to the next bike station (usually ~ 5 blocks away), with the hope to find some bikes are still available. By the time I got to Insight's office, the problem becomes to find an empty dock - the bike station right across Insight is almost always full. But luckily there is a large bike station just one block away, hence it is less of a concern. For the return trip, the same routine of finding bike and dock repeats. Although I don't expect that to find a Citibike anytime from any station as I want, but I really wish the bike availability can be better addressed, therefore I started this project. I am not naive to believe that this will bring the magic solution of any kind: there are people devoting Ph.D. thesis on this problem. Citibike do have put in efforts to better address this re-balancing problem, with various bulk bike transfer protocols. Lately, Citibike just launched bike angels program to incentivize riders to take bikes from bike-rich stations to bike-poor station. Here, I like to dig deeper to the data, and hopefully emerge with some insight.
The 'raw' data.
The readily avaiable data are the past trip data, from the beginning (mid-2013) until early this year (2017): there are more than 35 million trips! One (really) nice thing about the Citibike data is that they are very clean: the data is organized monthly, in .csv format, with only few N/A values to deal with. For each trip, the recorded information are: start station (name, id, latitude and longitude), start date / time, end station (name, id, latitude and longitude), trip duration, and bike ID. If the rider is an annual member, then the gender and age of the riders are also recorded, otherwise (for short-term users) these two fields are not available. Other information about the riders are all erased. Overall, more than 90% of the trips are taken by annual members, therefore I will only focus my effort data with these annual members.
Another nice thing about working with the Citibike data is that, many demographic data about New York City can be easily found, for example, from NYC Open Data, or US Census and American Community Survey. During the course of this project, I've also queried Yelp API for various local information. In the following sections, I will describe how I use (or not use) them.
In this project, I will only use the data from 2016, in which there are more than 12 million trips. By doing so, I can leverage the "big data" and a tangible model: it is big enough for me to capture the patterns in the data, but still small enough that my laptop can comfortably handle.
The goal, and the benchmarks.
Simply put, the goal of this project is to predict the end neighborhood of a Citibike ride when the bike is picked up by a member. If one can accurately predict the destinations of ongoing trips, then it can better guide the short-term re-balancing plans: some neighborhoods will be filled with the ongoing bike rides, whereas the re-balancing bikes can be routed to the would-be bike-poor neighborhoods. I am not trying to predict exactly which station the trip will go to: it just sound impossible: when I am riding a Citibike, I won't be sure which station I will be ended up with (to have available docks). To look at this problem at neighborhood level, I first assign all the stations to different neighborhoods, whose centroid is the closest: it turns out there are 60 neighborhoods in which there is at least one Citibike station. Then let's define a metric to measure the success: the simplest one is just the percentage of right answer (1 of the 60 total end neighborhood) the model predicts: 0 is the worst and 100% is the best.
Let me improve my guess a little bit more: from the trip data, the median travel time for Citibike riders is about 10 minutes, so it is reasonable to guess the trip will end up in the same neighborhood as the start station, or end up in the closest neighborhood from the start station. Using such guesses as my predictions and compare them to the 'truth', the former guess gives me an accuracy of 13.2%, and the latter gives me 11.8%.
The last benchmark I come up with is to make a more educated guess, by looking at the trip history of individual stations. Then for a new trip that starts from this station, I will always guess it will go to the most frequent end neighborhood for this station. This benchmark turns out to be surprisingly good, at 19.2%, and at the end I only manage to barely beat this benchmark.
I want to point out that, other than the first benchmark (8.9%), the other three all take some form of decision tree: I first find out what the start station is, then the predictions are made based on this information. Loosely speaking, all these three can be considered as primitive classification models, not totally 'random' guess.
Feature engineering.
Given the fact that I want to 'predict' a rider's behavior (where is he or she going), I like to know more about this rider. From the raw trip data, the only information I have about the rider are: gender, age, and the fact that he or she picks up a bike from one specific station at a specific date / time. I don't have any information such as rider id, therefore there is no any 'history' for each rider. How can I differentiate riders having the exact same information as above? One possible 'differentiator' can be weather: those 'identical' riders might have different weather preference. I requested the historical daily weather data for New York City from National Oceanic and Atmospheric Administration (part of National Weather Service), and attached the daily weather conditions to the existing trips. Next I attempted to describe each station in more 'detail'. Although we as human, can tell the difference between different stations - one from Grand Central seems quite different from the one from 110th Street: the former is much busier because of the train station. But how would the model know? All it sees now is just a station id. Therefore, I attempt to add some station-specific features, to 'guide' the model to find the right answers. In essence, I want to build a 'fingerprint' for each station. The ideas that I've come up with include: the distance to other stations, and other neighborhood centroids; the histogram of the past end neighborhoods for each station; the population and median house income of the closest census block to each station; and numbers of various kinds of business within 250-meter radius (average distance between stations), queried from Yelp API, which allows for 25,000(!) queries every day. The businesses that I searched include restaurants, dry cleaners, schools, etc. However, it turns out only the distance between stations, and the end neighborhood history made significant differences.
What I really wish, is the historical trips of individual rider, similar to the browser cookie for a web-surfer. Citibike must have it, but I think I've done what could be done from my end...
Model selection and performance.
Now I am geared with all the features, old and new, useful and useless (which I don't know yet), it comes to the time to find and tune the best model. This problem is a typical multi-class classification problem, with more than 10 million sample, with hundreds of features (after one-hot encoding), and 60 classes. The package I used is sklearn (also known as scikit-learn), and xgboost. I first tried the usual candidates, namely, logistic regression, support vector machine, random forest, and gradient boosted trees (with xgboost).
But the first problem I am facing is how to handle the 10 million samples. My laptop can load all of them in, but running some regression models on all of the 10 million samples almost always killed the jupyter notebook. Therefore, for the majority of the model selection, I only randomly sample 1% of the total data (about 100,000 samples), and then I split this data 80/20 for training and test purposes. Whenever the option of stochastic gradient descent (SGD) is available (for logistic regression and support vector machine), I will adopt SGD for the efficiency.
To combine both the feature and model selection, I am doing a manual gridserch: starting from the bare features (directly obtained from the trip data), all the four models are trained and validated (against test data), and then add a new set of features in. Occasionally, I will tune the hyperparameters, mostly with gut intuitions. I've also found that it is quite hard to track the progress of xgboost: I have to run couple fittings with small sample sizes to extrapolate the expected time for the 'real' problem. This is my first time using xgboost for a real problem (aside from tutorials), therefore it might just be my inexperience.
What is more, if I can exploit the total 10 million samples, instead of just the 1% that I am currently using now, there might be a boost to the accuracy. There might be a point, beyond which more samples won't bring proportionally more return, however, that is not something I can easily to access at this point. It is definitely worth looking.
What I have achieved / learned.
Looking back for the last 4 weeks, two things struck me. First, how fast the 4 weeks have come by: the weekly roadmap outlined by Emily (one of our program directors) is still very much vivid in my head, and the pointer is still at week 1, day 1. Since then, I, like many other fellow Insight Fellows are failing at various project ideas, hammering out minimum viable projects (MVPs), practicing demos, working together late to midnights, just to get the websites live, and we have done that! Secondly, I am struck by how much I've learned within such short period of time. The Insight staffs are immensely helpful, and the schedules are carefully crafted (and crazy of course). Getting through the whole process, from data collection to the frontend deployment really helped me to better understand what lies ahead, waiting for me.
Back story 1: how I got here.
During the first week of the Insight program, we were asked to come up with some project ideas. The staffs from Insight provided us with some general directions, in which the first one is about the different bike share programs in US. The data are possibly rich: other than Citibike in New York, other programs such as Divvy (Chicago), Hubway (Boston) also provide similar system data. One idea is to mine those data from different cities, and to evaluate the 'success' of each program. In doing so, one might arrive at a 'recommendation system' for new cities which considers to start a bikeshare program.
However, there are three major challenges. The first one is the data availability: there are about 60 cities in US that run bike share programs, but not all of them make data available. Without the direct access to the data, it won't be possible to get anything done in the first place! But I was not quite deterred by this seemingly insurmountable difficulty: it turns out there is a workaround. Folks at citybik.es have done a great job at making an API that can query the bike availability for ALL(!) the bike stations in the world. I wrote a small python script to frequently (every 2 minutes or so) call the API to get the status of all the bike stations in US. By comparing the number of available bikes with time, I can indirectly derive the bike usage and trip count. In this way, the first challenges is somewhat resolved.
The second challenge is to come up with a meaningful metric for 'success'. A common definition for success would be the profit margin. But neither a bike share program is for profit (though the Seattle's Pronto bikeshare was recently shutdown due to financial reason), nor I have any access to the financial reports. Therefore, the metric I came up with is the trips per bike per day, which I can calculate from the aforementioned web-scraped data. This number ranges from > 2 (New York) to 0.005 (West Palm Beach, Florida). Given such a wide range of the 'success' metric, it seems there is a possibility to derive a meaningful model that can predict these metric (But the sample size is just about 60). The following table shows the cities with top-10 trips per bike per day, scraped between June 4 and June 7 (Sunday to Wednesday).
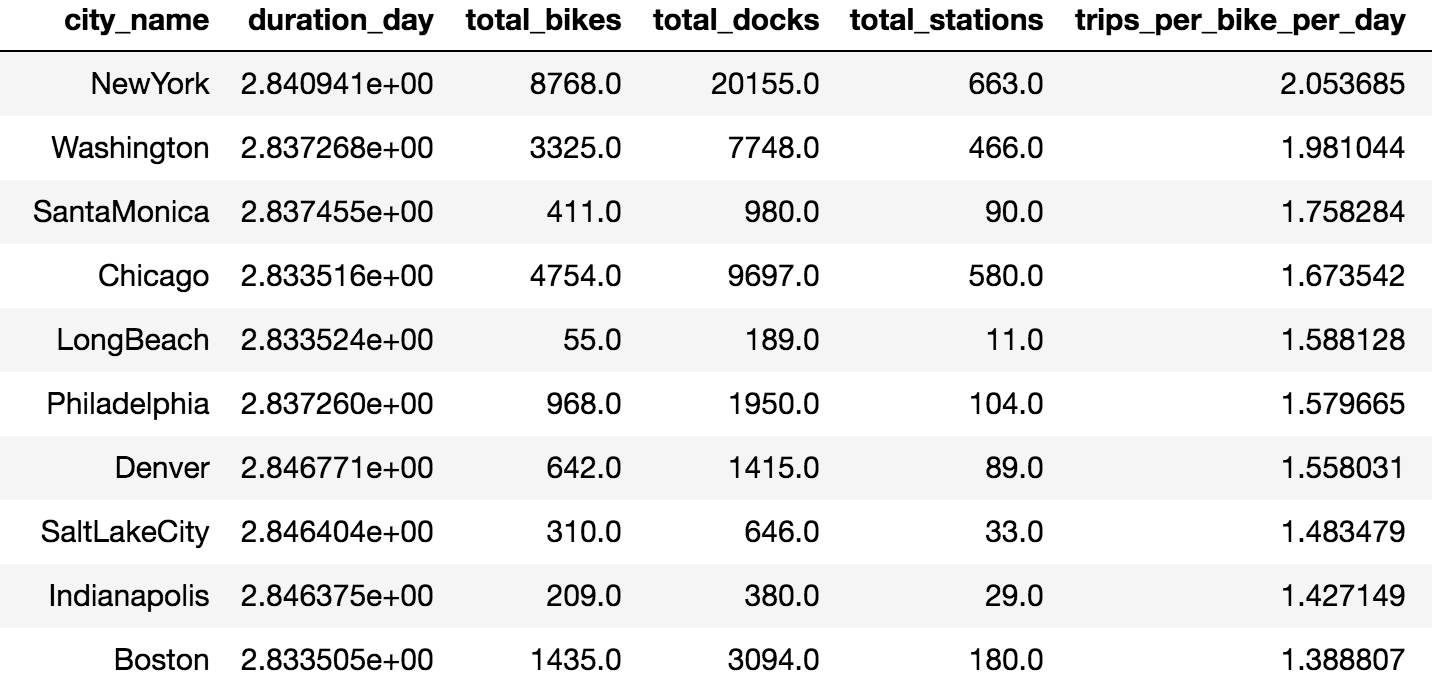
The third challenge is what features to collect (and how), that can be used in such a supervised learning setting (regression to the metric). The natural candidates come to mind are: city size, population, crime rate, income, total mileage of bike lanes... the list goes on and on. I was able to find some of these information rather quickly, such as city size and population (some even from wikipedia!). But beyond that, it quickly became something too demanding. It also deviates from my original plan: I want to have some taste of the big data and model building, so spending most of the time on collecting data doesn't quite excit me at this point. Even I can get all the features I wanted, and the metric I come up is meaningful, the deciding factors (signal) might not be reflected from those features. The success might depends on the contract details, or local politics, which no data can help. After some discussions with the program director, I decided to abandon this plan.
The pivot is to zoom in, hence I rollback to the Citibike data, since (i) the data is large and clean, (ii) the New York City has done a great job archiving various demographic datasets, and (iii) the contract / politics factors would be homogeneous. The rest is this project.
Back story 2: the model with 99% accuracy.
For the fellows who have sit in my previous demos, they might be surprised by my claim of 99% accuracy of the model. That is right, 99%, not 20%. I didn't pull this number out from my hat, I genuinely believe in it! Both the random forest and boosted trees give me the same answer. I tried different portions of the data, still holds! What makes it more believable is that, I can see the accuracies of the models gradually improve as I add more features in, that is like the ultimate feature engineering (that was the Wednesday of week 3, I then allowed myself an 8-hour sleep that night, problem solved!). Look how smart I am! Despite warnings and doubts from Insight alums and staffs, I even came up with the explanation that, there are only 200,000 unique members riding those 10 million trips, and my model is able to identify their behavior very well. Almost convinced everyone, myself included. Not matter how extraordinary the claim is, I am in heaven.
Then on the flight back to Chicago, on the Friday of week 4, I found something doesn't add up: while putting drastically different input to the website, I always get similar results. I went into fully debugging mode, tracing one step back at a time, and finally I found the culprit: I made a mistake at the very beginning, when I am making the data set. Instead of merging two tables on the 'start station id' key, I merged them on the 'end station id' key. By doing so, some information about the answer is leaked to the features. Given the power of the appropriate models (I guess I can be proud of this part...), they will of course get the 99% accuracy - it should get 100% accuracy!
By the time the plane landed, my heart sinks to the bottom of Michigan lake, it is the scenario of the recent play (Queen) we saw in real life! Over the weekend, I was working with my wife (who can be a much better Data Scientist than I will ever be, if she chose to do so) to find a way to salvage the project. Gladly I've all the data pipeline established, we quickly tried few more ideas. Sadly, I came to the conclusion that, with limited information about the rider, there doesn't seem to be other ways to differentiate them. Intuitively, if a human can not make a sensible prediction with such information, how would a model can?
Well lesson learned: models with 99% accuracy is possible (think MNIST), but without clear verification that a human can achieve the same level of performance with the same information, we need to be very skeptical.
So long, the model with 99% accuracy.